In vegetable, horticultural and agronomic research greenhouses, light is not measured in lux or lumens. What matters to the plant is the number of photons it can actually absorb for photosynthesis and morphogenesis. The IndiGo LightMeter combines the precision of an intensity-calibrated spectral bench (400–750 nm) with the mobility of a Bluetooth probe connected to your smartphone, for instant mapping of photosynthetic radiation at canopy level.
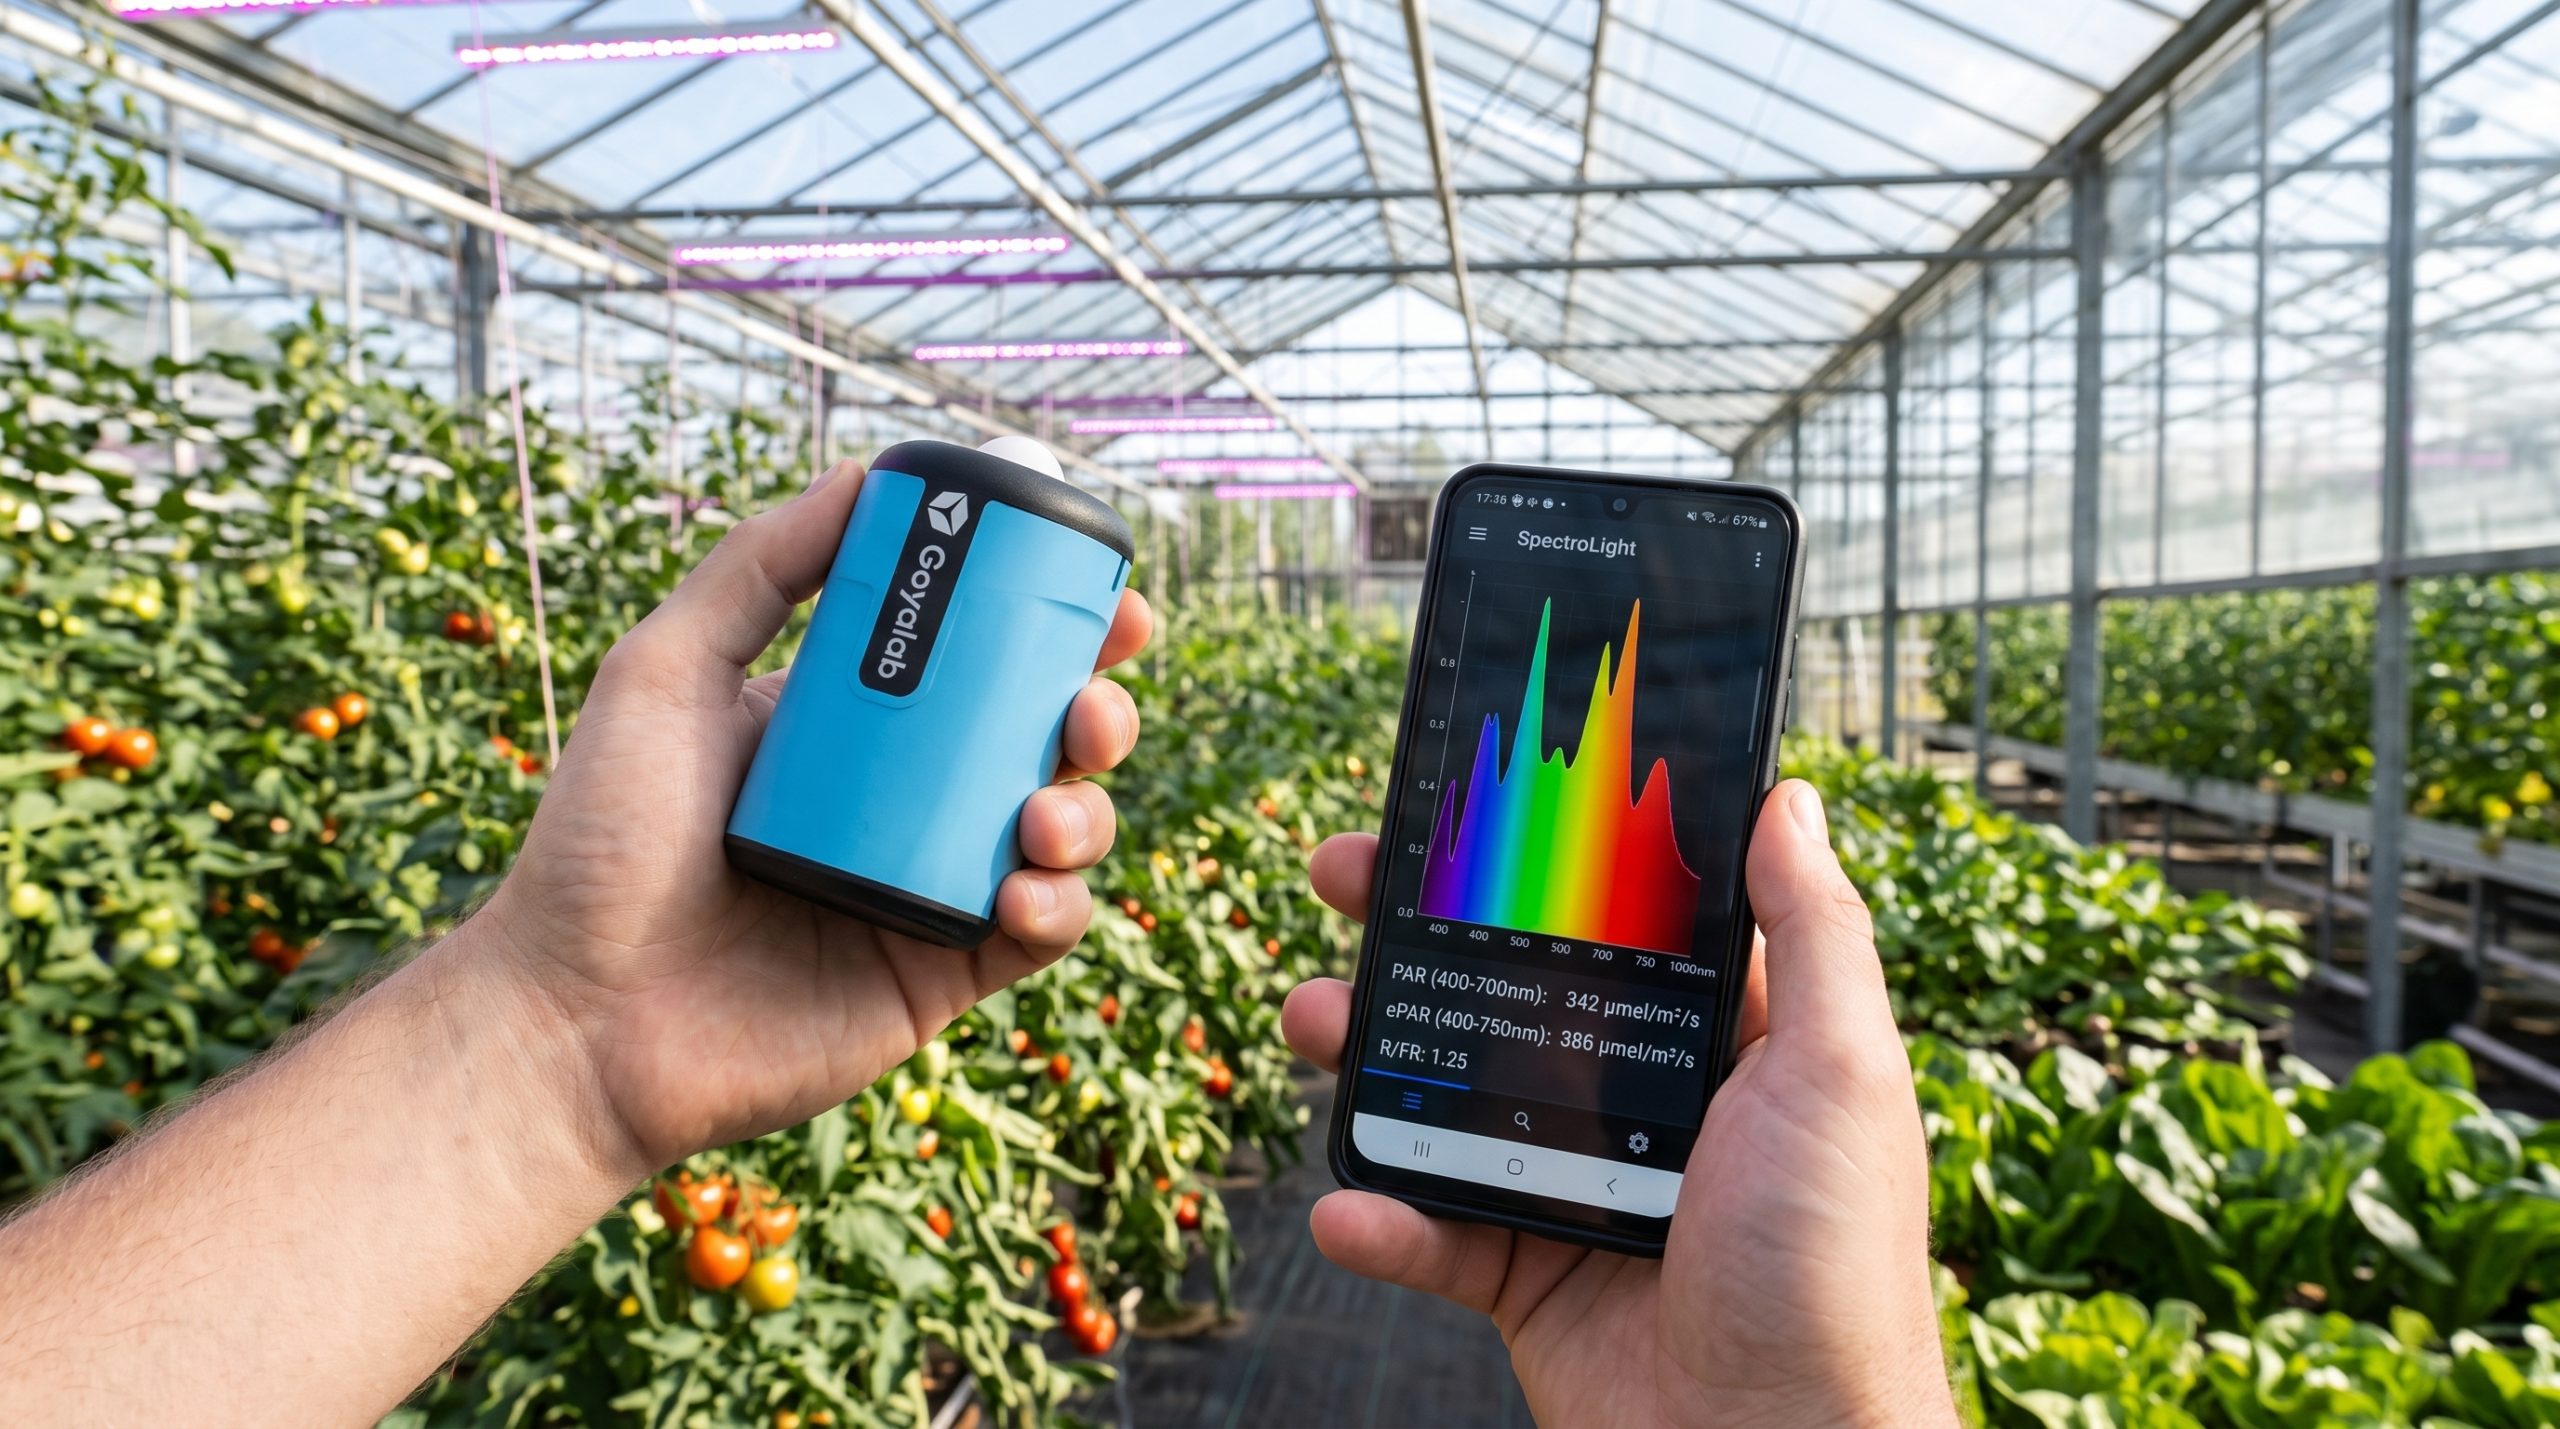
The IndiGo LightMeter in a greenhouse: instant measurement of PAR, ePAR and the R/FR ratio, displayed live in the SpectroLight mobile app.
Why go beyond a simple quantum sensor in the greenhouse?
Conventional broadband quantum sensors give an overall PPFD value without distinguishing wavelengths. Yet in a greenhouse, the light reaching the crop is a dynamic mix of natural sunlight and supplemental artificial lighting (LED, HPS):
- The spectral composition changes constantly: depending on cloud cover, season, and dirt or whitewash on glass/polycarbonate walls, the spectral profile received by plants keeps fluctuating.
- Plants respond to specific colors: vegetative growth, flowering, branching and the synthesis of aromas or antioxidants depend directly on precise wavelengths (blue, red, far red).
- A spectral view is essential: only spectroscopy can confirm that the “light recipe” delivered by your supplemental luminaires effectively makes up for the lack of daylight.
Key horticultural metrics measured with the IndiGo LightMeter
With its intensity calibration stored in memory and its 400–750 nm range, the IndiGo LightMeter calculates all the fundamental indices live in the SpectroLight app:
| Indicator | Spectral band | Direct agronomic impact |
|---|---|---|
| PPFD (photosynthetic photon flux density) |
400 – 700 nm (in μmol·m-2·s-1) |
Measures the instantaneous light intensity available to activate chlorophylls a and b. Basis for calculating the DLI (daily light integral). |
| ePAR (extended PAR) |
400 – 750 nm | Includes far red (700–750 nm). Accounts for the Emerson effect, where combined red and far-red light boosts overall photosynthetic efficiency. |
| R / FR ratio (red / far red) |
660 nm / 730 nm | Regulates the phytochrome state (Pr / Pfr). A low ratio signals shade and triggers stem elongation, while a balanced ratio promotes compact growth. |
| B / G / R spectral balance | Blue (400-500 nm) Green (500-600 nm) Red (600-700 nm) |
Blue regulates stomatal opening and compactness; green penetrates deep into the lower canopy layers; red maximizes biomass accumulation. |
An instrument built for the field and the canopy
The IndiGo LightMeter is designed to remove the constraints of measuring in greenhouses:
- Angular collection up to 70°: its built-in front cosine corrector provides spatial integration that follows Lambert’s law, essential for capturing diffuse light under glazing or wide-angle horticultural reflectors.
- No cumbersome cables: thanks to Bluetooth Low Energy (BLE), hold the spectrometer at arm’s length above the crop or mount it on a pole/tripod with its optional standard 1/4″ thread, while reading the data in real time on your smartphone.
- 8 hours of continuous battery life: a built-in battery sized to cover several hectares of greenhouses without recharging.
- SpectroLight for Android: a clear interface to record geo-referenced or time-stamped measurement points, compare crop rows and export spectra to CSV in one tap.
Practical greenhouse use cases
1. Uniformity mapping of supplemental lighting
Check PPFD uniformity at crop-top height to detect shaded areas or over-irradiation caused by poorly positioned LED luminaires. Ensure synchronized growth across the whole bay.
2. Transmittance audit of roofs and shade screens
Measure the spectrum before and after it passes through greenhouse walls or thermal screens to quantify PAR losses and identify spectral drift caused by aging plastics.
3. Validation and monitoring of light recipes
For nurseries and high-value crops (vegetable seedlings, strawberries, medical cannabis, cut flowers), precisely validate the vegetative and generative spectra applied by your lighting controllers.
💡 Need to audit your horticultural installations?
GoyaLab puts its optical metrology expertise at the service of growers, seed companies and agronomists to optimize the photosynthetic performance of your crops.
👉 Contact us for a demonstration or a quote for the IndiGo LightMeter
📄 Learn more about the instrument: see the detailed IndiGo LightMeter product page or explore our page on photometric characterization of LED luminaires.